Since the war with Iran began, oil and the fuels refined from it have soared. Brent crude averaged $114.08 a barrel in September on the Energy Information Administration's daily spot series, up from $70.89 in February. US retail diesel set a record, and the G-7 has agreed to release emergency stocks to bring it down. Natural gas at Henry Hub in Louisiana, the American benchmark, averaged $2.95 per million British thermal units.
That is two cents less than in September 2025. It is lower than February's average of $3.62, though February is a winter month and gas is usually dearer then. On the last day of the EIA's data, 29 September, it was $3.18.
Measured by heat content, the gap is wider than the prices suggest. A barrel of crude holds about 5.8 million Btu. At September's average prices, a unit of energy bought as Brent crude cost almost seven times as much as the same unit bought as American gas. In February the multiple was about 3.4.
Gas everywhere else
The rest of the world is not paying American prices. In late September, gas traded near $24 per million Btu at the Dutch Title Transfer Facility, Europe's benchmark, and $26 at the Japan-Korea Marker in Asia, Reuters reported. The Al-Attiyah Foundation, a Doha research group, said in mid-September that the average price for LNG cargoes delivered to north-east Asia in October had reached $27, a 45-month high.
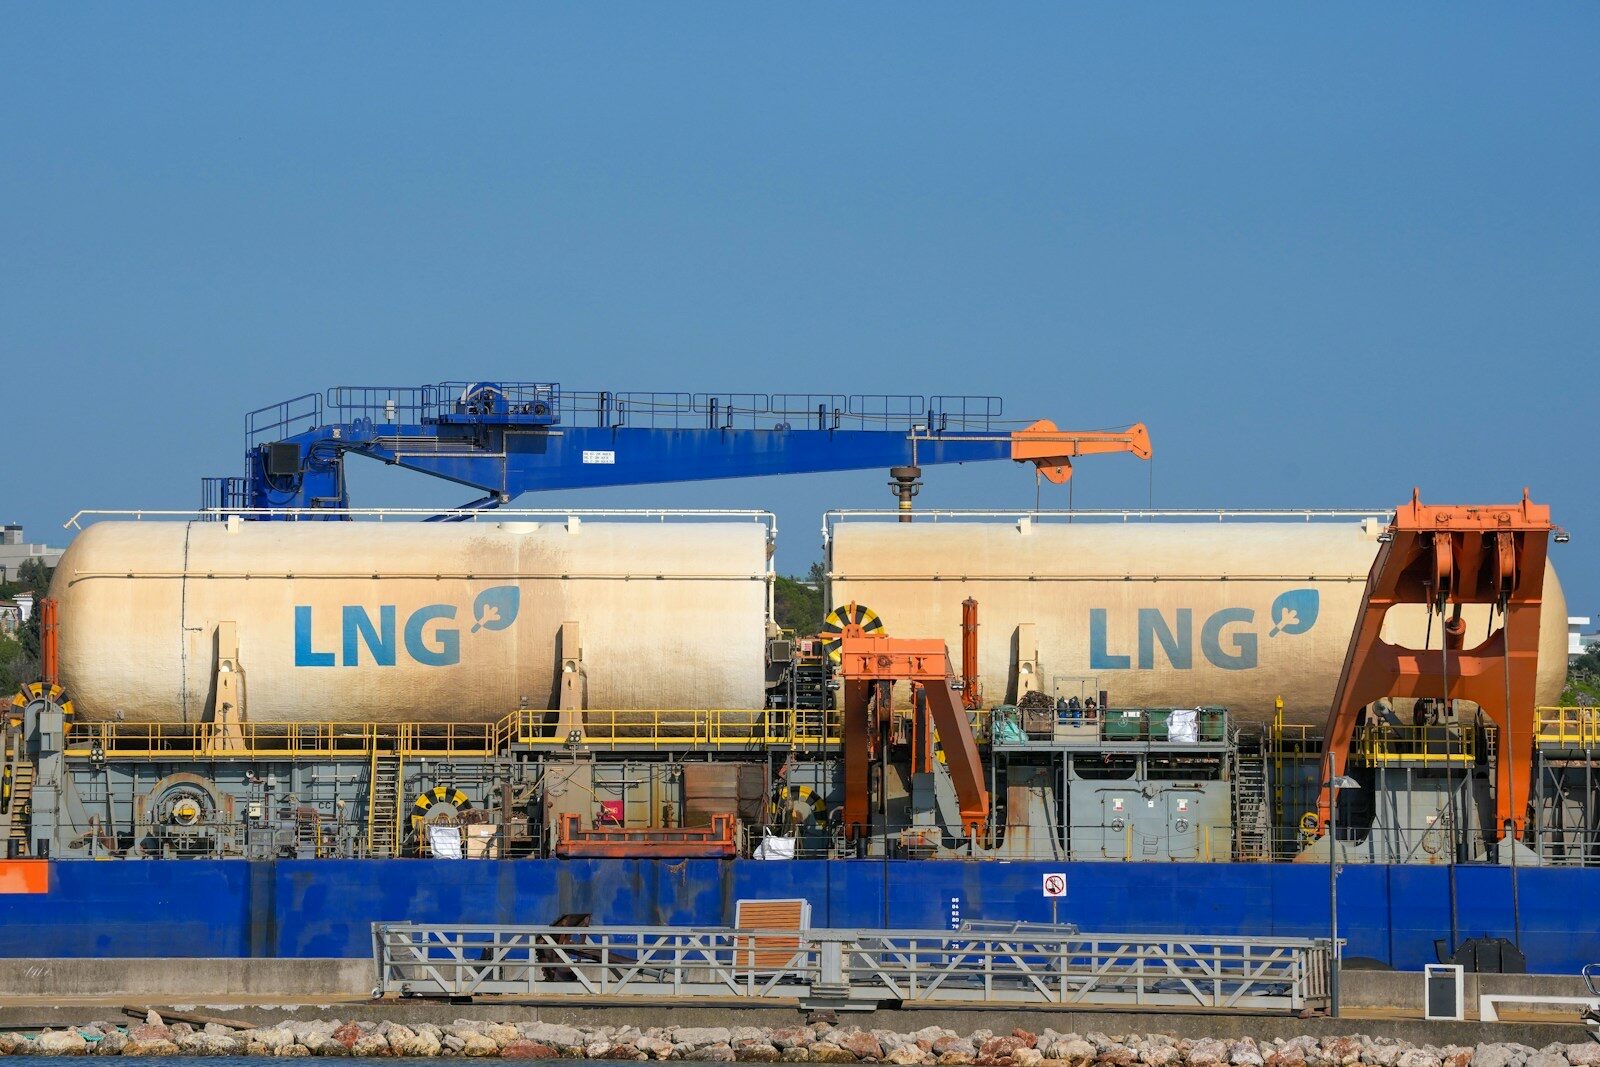
The conflict in the Middle East has disrupted supplies of liquefied natural gas, and Europe and Asia are competing for the cargoes that remain. Gas in Europe costs about eight times what it does in Louisiana. The obvious response would be for American exporters to ship more. They cannot.
"Prices in the US, however, have not reacted much to the war in Iran because the US produces all the gas it consumes domestically and U.S. LNG companies are already liquefying as much fuel as they can," Reuters wrote. Flows of gas to the nine big US export plants averaged 17.9 billion cubic feet a day in September to the 25th, according to LSEG data cited by Reuters. The record is 18.8 billion, set in April. September's flows held up even though the Cove Point plant in Maryland shut around 19 September for several weeks of planned maintenance.
No matter how high global prices go, Reuters noted, the United States cannot export much more LNG until plants now under construction start up. The EIA forecasts US LNG exports averaging 17.4 billion cubic feet a day this year, up from 15.1 billion in 2025, and 18.6 billion in 2027.
The supply side
While exports are capped by capacity, production keeps rising. US output in the lower 48 states averaged 112.5 billion cubic feet a day in September to the 25th, according to LSEG, above the monthly record of 112.3 billion set in August.
A large share of that growth comes from oil wells. In its September outlook, the EIA said most natural gas produced in the Permian basin of Texas and New Mexico is associated with crude oil, and that the region's wells are yielding more gas per barrel: nearly 4,200 cubic feet in 2025, 15 per cent more than in 2021. A new pipeline out of the Permian, Energy Transfer's Hugh Brinson line, began shipping gas in June. The EIA expects Permian gas output to grow by 1.7 billion cubic feet a day this year and the Haynesville, near the Gulf Coast export terminals, by 1.4 billion.
The result is a well-supplied market heading into winter. Working gas in storage was 3,415 billion cubic feet on 25 September, the EIA said on Thursday, 79 billion above the five-year average, though 138 billion below a year earlier. The agency's September forecast expects 3,969 billion cubic feet by the end of October, 5 per cent above the five-year average.
Traders appear to agree. In late September the premium of November gas futures over October fell to a record low of about 7 cents, Reuters reported, a sign that the market is not worried about supply meeting demand this winter.
What could change it
The insulation is not total. Gas is the fuel for about 40 per cent of US electricity, and a cold winter would draw on storage faster. New export capacity, as it comes online, will connect more of American supply to world prices. The EIA's September forecast put the Henry Hub price at an average of $3.43 for 2026, a year that included a January spike above $30, and $3.28 for 2027.
For the moment, though, American households and factories are buying gas at a commodity price that has barely moved, while their counterparts in Europe and Asia pay for the energy shock. The barrier that protects them is the same one that keeps American producers from cashing in: there is only so much gas the country can ship.
Henry Hub and Brent spot prices are from the Energy Information Administration's daily series, as published on eia.gov and FRED (DHHNGSP, DCOILBRENTEU), with data to 29 September 2026; monthly averages, the change in Brent since February and the energy-equivalent comparison (using 5.8 million Btu per barrel of crude) are this publication's calculations. Production, LNG feedgas, futures prices, the October-November spread and international gas prices are from Reuters' natural gas market report of 25 September 2026, citing LSEG, as published by Pipeline & Gas Journal. Asian LNG prices for October delivery are from the Al-Attiyah Foundation's weekly energy market review, as reported by The Peninsula (20 September 2026). Storage figures are from the EIA's Weekly Natural Gas Storage Report of 1 October 2026. Forecasts, the Permian gas-to-oil ratio and regional production growth are from the EIA's Short-Term Energy Outlook of 9 September 2026. Accurate to 9pm ET on 3 October 2026.
Topics marketsnatural gaslngoil pricesenergycommoditiesbrent