In January, the federal government's oil forecasters expected Brent crude to average $54 a barrel in 2027. In July they expected about $65. The edition published on Tuesday says $86.
The Energy Information Administration's Short-Term Energy Outlook for November, released on 10 November 2026, forecasts Brent at an average of $97 a barrel this year and $86 in 2027. It is the fourth monthly increase in a row in the 2027 forecast. The agency expects the spot price to stay "near $100 per barrel" for the rest of this year.
Every edition this year, side by side
The agency keeps each month's forecast spreadsheet in its archive, so its changes of mind can be counted. We took the monthly figures from Table 2 of each edition and averaged them by year.
| Edition | Brent, 2026 | Brent, 2027 | Gasoline, 2027 | Henry Hub, 2027 |
|---|---|---|---|---|
| January 2026 | $55.92 | $54.00 | $2.95 | $4.59 |
| February | $57.80 | $53.00 | $2.92 | $4.38 |
| March | $78.71 | $64.50 | $3.17 | $3.85 |
| April | $95.64 | $76.25 | $3.46 | $3.59 |
| May | $94.49 | $79.50 | $3.61 | $3.18 |
| June | $95.00 | $79.50 | $3.64 | $3.46 |
| July | $81.87 | $64.83 | $3.09 | $3.49 |
| August | $86.69 | $69.50 | $3.29 | $3.31 |
| September | $90.86 | $74.00 | $3.35 | $3.28 |
| October | $96.12 | $84.00 | $3.56 | $3.16 |
| November | $97.20 | $86.00 | $3.73 | $2.88 |
Two things stand out. The 2027 oil forecast has been revised up by $33 since February, and about two-thirds of that, $21, has come in the four editions since July. And the natural gas forecast has moved the other way, from $4.59 in January to $2.88, the lowest of the year.
How far off was October?
By $12.93 a barrel. The October edition expected Brent to average $111 in October. The November edition's data show it averaged $123.93. Our report on OPEC+ on 1 November found Brent ending October's last week $12.64 above the agency's forecast for the quarter.
The agency did not chase that miss forward. Its forecasts for November and December, $104 and $99, are the same in the November edition as they were in October's. The fourth-quarter figure rose only because October is now an actual number rather than a forecast.
The daily prices bear out the lower path so far. Brent spot was $107.39 on 2 November and $107.03 on 3 November, the most recent days in the agency's daily series when it was released on 4 November, down from $120.15 on 30 October.
Why does 2027 keep going up?
Inventories, on the agency's account. It cites "falling global inventories" in October and attacks on oil tankers in the Persian Gulf, and it now expects depleted global stocks to be rebuilt through 2027 rather than sooner. U.S. commercial crude inventories fell to 410 million barrels at the end of October, the lowest for that time of year since 2014, and are expected to stay below their five-year average until the middle of 2027.
The forecast assumes that Middle East production outside Iran returns to its pre-conflict average by the middle of 2027, and it has Brent falling to $77 by the fourth quarter of 2027. On our reading, that assumption carries much of the decline from $97 this year. American output helps: the agency expects U.S. crude production to reach a record 14.3 million barrels a day in 2027, up from 13.9 million this year.
What it means at the pump and the meter
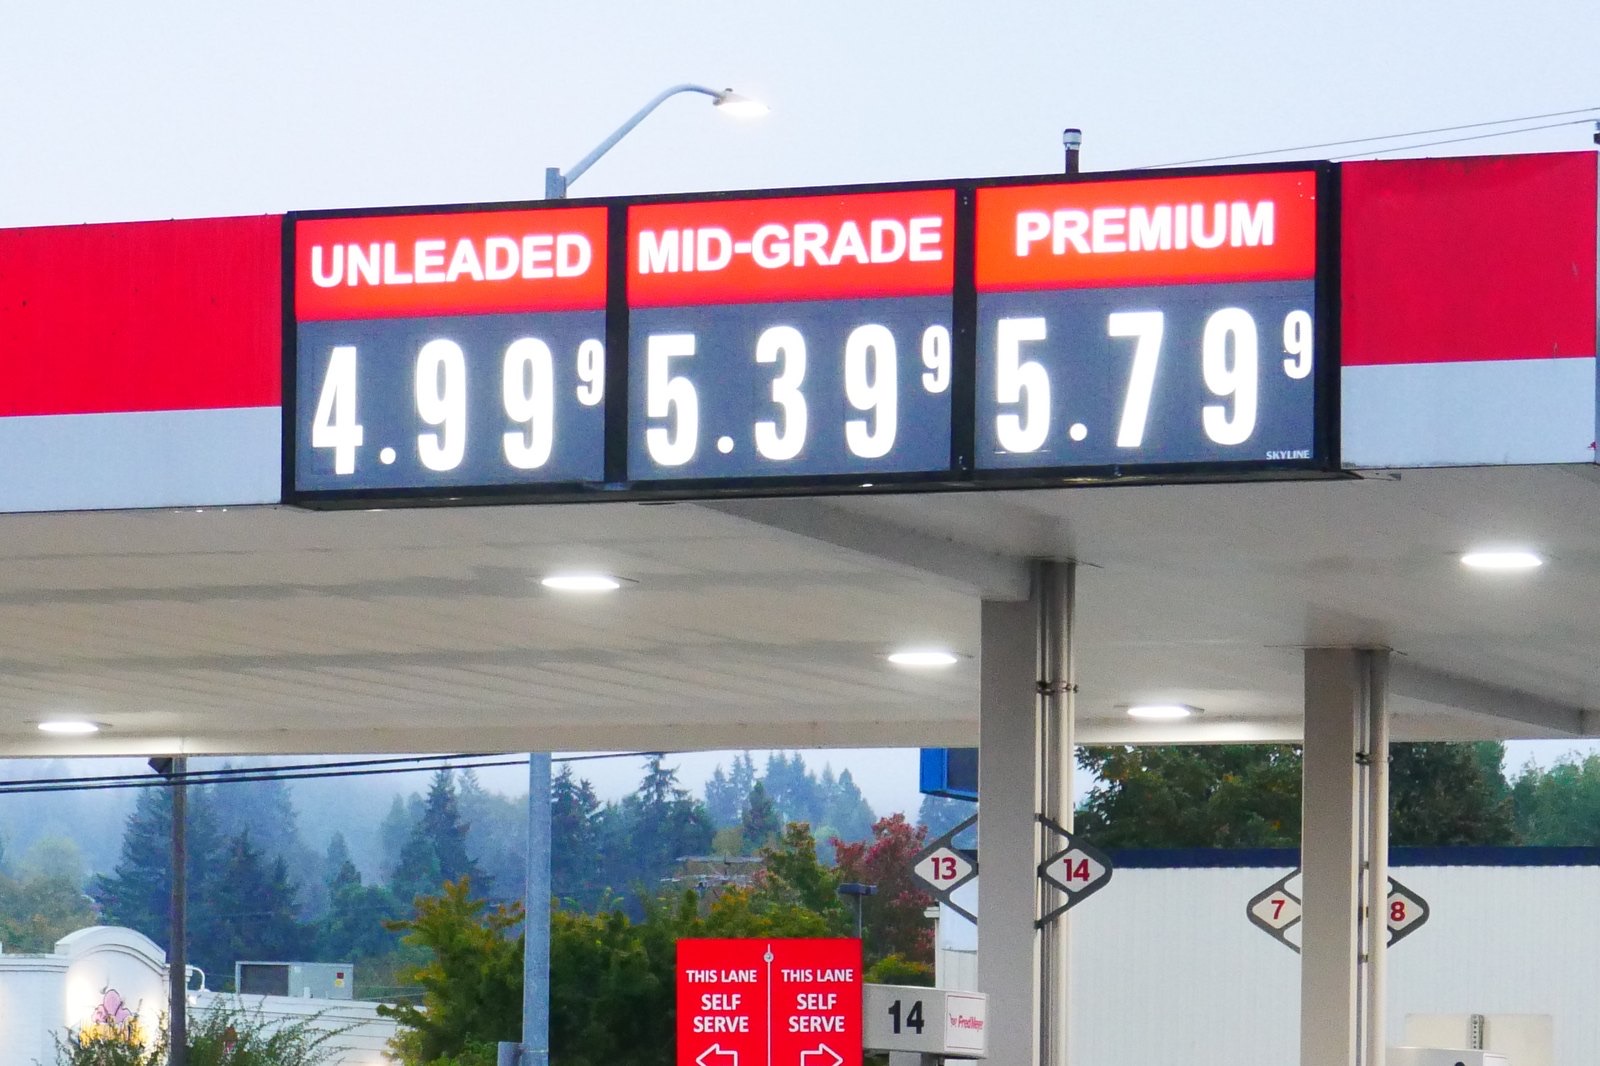
Regular gasoline is forecast at $3.89 a gallon this year and $3.73 in 2027, according to the agency. Our averages of the monthly figures show the 2027 gasoline forecast up 64 cents since July. Fuel is the part of the economy where the forecast and the inflation figures meet: on our estimate, energy prices were about 21 per cent higher in October than a year earlier.
Natural gas is the relief. The agency now expects the Henry Hub price to average $2.87 per million Btu from November through March, 16 per cent below its previous expectation, and $2.88 across 2027. It has cut its 2027 gas forecast in each of the four editions since July. We noted in October that American gas had barely moved while oil soared.
The next outlook is due on 8 December, the day the Federal Reserve's two-day meeting begins. If the November and December forecasts of $104 and $99 hold, the December edition should leave the 2026 average close to $97. If they do not, the run of increases in the 2027 forecast is the number to watch.
The November forecasts, the release dates, the inventory, production, electricity and winter gas figures and the quoted phrases are from the Energy Information Administration's Short-Term Energy Outlook page of 10 November 2026. Forecasts from earlier editions, monthly values and the October 2026 Brent average are from the agency's archived STEO spreadsheets (Table 2, energy prices) for November 2025 through November 2026, downloaded on 11 November 2026. Daily Brent spot prices are from the agency's spot price series, released 4 November 2026. Annual and quarterly figures for earlier editions are simple averages of each edition's monthly values, this publication's arithmetic, and match the agency's published annual figures for November where it states them. The analysis is our own.
Topics marketsoilgasoline pricesnatural gasHenry Hub