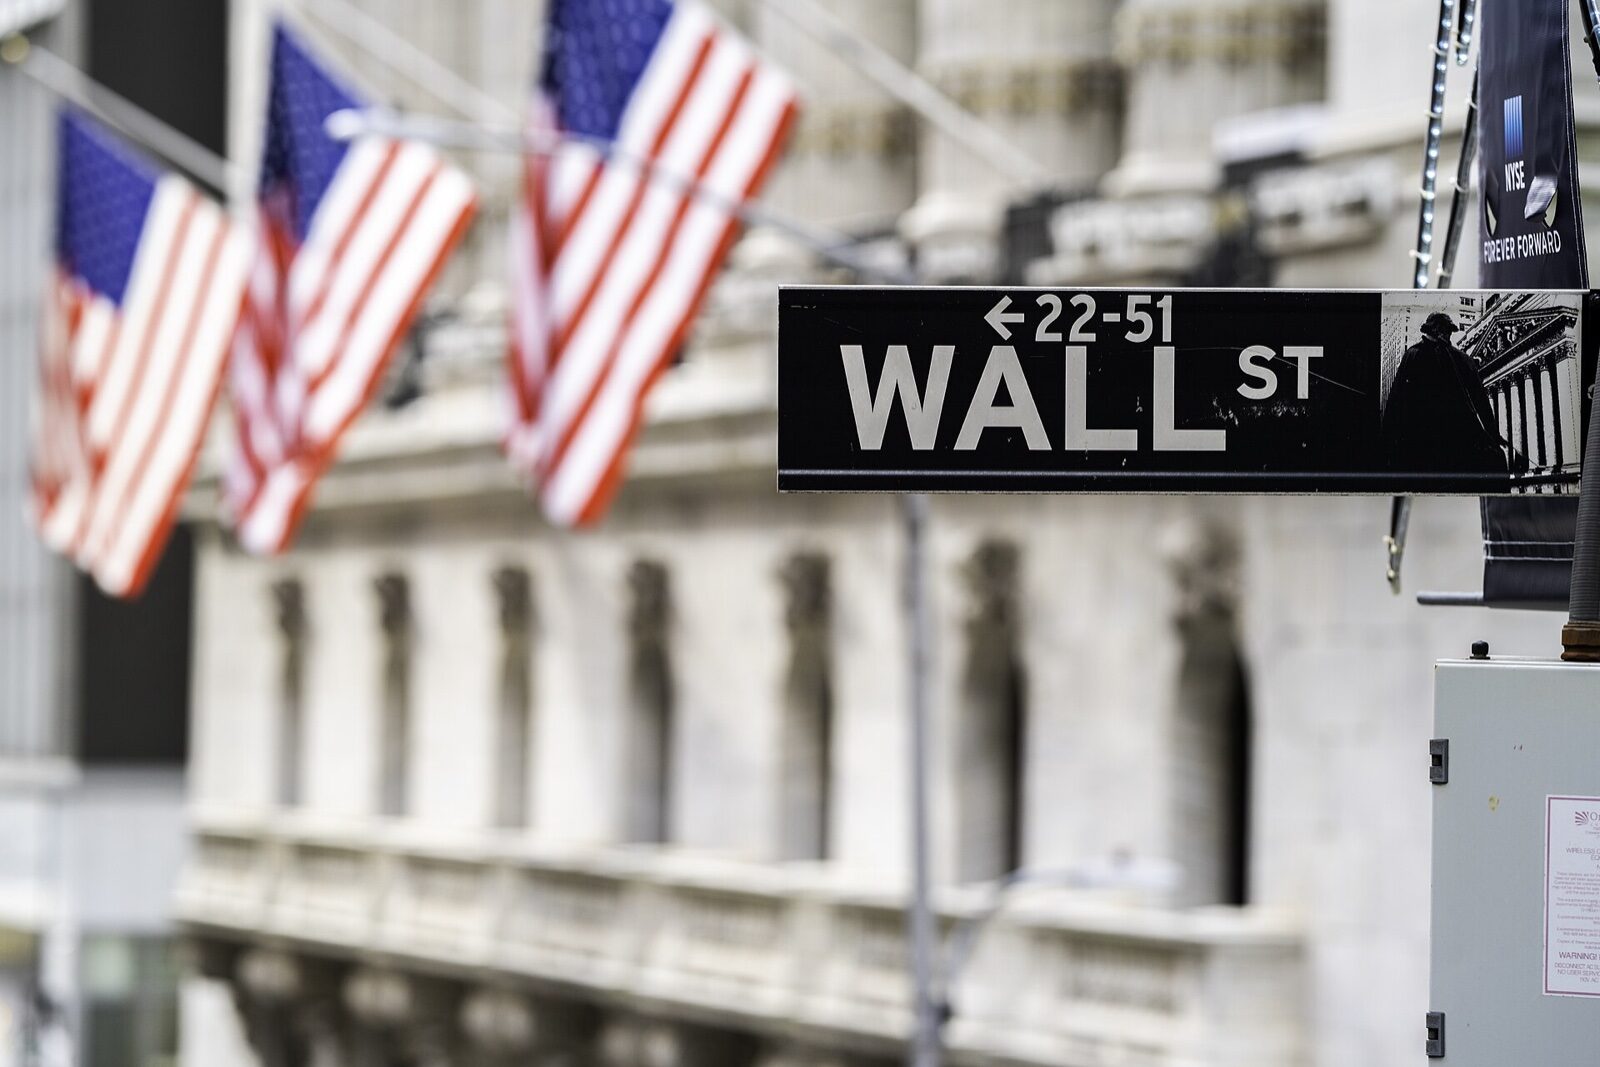
The S&P 500 rose in the 12 months after 18 of the 19 U.S. midterm elections held since 1950, and was flat after the 19th, by this publication's count of the index data compiled by Yale economist Robert Shiller. Americans vote in the 20th such election on Tuesday, 3 November 2026.
That record is often repeated around Election Day. We did the arithmetic ourselves, from a primary data series, and found that it holds up, with two qualifications. The sample is small, and the gap it shows is as much about the years that came before as about the vote. Past returns do not predict future ones. Polls close tonight, and no result is known.
What is on the ballot?
Every one of the 435 seats in the House of Representatives is up, as it is every two years under Article I of the Constitution. In the Senate, 33 seats are up in the regular cycle, according to the Senate's own list of Class II senators, whose terms end on 3 January 2027. Two more, both held by Republicans, are special elections in Ohio and Florida, Ballotpedia reported, for 35 in all. Thirty-six states elect governors, along with Guam, the Northern Mariana Islands and the U.S. Virgin Islands, according to the National Governors Association.
For a business reader, the federal ballot matters less for who wins than for what the winners inherit, and when. The new Congress is sworn in on 3 January 2027. The one now sitting returns first, and its calendar is already full.
What have stocks done after past midterms?
They rose in all but one case, and by more than in other years. Our table uses the monthly S&P Composite level in Mr. Shiller's data workbook for November of each midterm year and for November a year later. The series runs back to 1871. For the two most recent midterms, his November figures match, to the cent, the average of that month's daily closes in the S&P 500 series published by the St. Louis Fed, which is how we checked them.
S&P 500 in the 12 months after each midterm, November to November (this publication's arithmetic from Shiller data)
| Midterm | November level | A year later | Price change | Real total return |
|---|---|---|---|---|
| 1950 | 19.83 | 22.71 | +14.5% | +14.8% |
| 1954 | 33.44 | 44.95 | +34.4% | +39.4% |
| 1958 | 52.50 | 57.23 | +9.0% | +11.0% |
| 1962 | 60.04 | 72.62 | +21.0% | +23.2% |
| 1966 | 80.99 | 92.66 | +14.4% | +15.0% |
| 1970 | 84.28 | 92.78 | +10.1% | +10.0% |
| 1974 | 71.74 | 90.07 | +25.6% | +22.2% |
| 1978 | 94.71 | 103.70 | +9.5% | +2.4% |
| 1982 | 138.10 | 165.20 | +19.6% | +21.0% |
| 1986 | 245.10 | 245.00 | -0.04% | -1.5% |
| 1990 | 315.29 | 385.92 | +22.4% | +22.8% |
| 1994 | 461.01 | 595.53 | +29.2% | +29.1% |
| 1998 | 1,144.43 | 1,391.00 | +21.5% | +19.9% |
| 2002 | 909.93 | 1,049.90 | +15.4% | +15.4% |
| 2006 | 1,388.64 | 1,463.39 | +5.4% | +2.8% |
| 2010 | 1,198.89 | 1,226.42 | +2.3% | +0.8% |
| 2014 | 2,044.57 | 2,080.62 | +1.8% | +3.3% |
| 2018 | 2,723.23 | 3,104.90 | +14.0% | +13.9% |
| 2022 | 3,917.49 | 4,460.06 | +13.9% | +12.2% |
Real total return counts reinvested dividends and subtracts consumer price inflation, as Mr. Shiller's series does. On either measure, 1986 is the only year that did not rise. The October 1987 crash fell inside that window.
The average price gain across the 19 windows was 14.9 per cent and the median 14.4 per cent. For the 56 other November-to-November years from 1950 to 2024, the same arithmetic gives an average of 7.4 per cent and a median of 10.2 per cent, with 38 of the 56 years rising. After inflation and dividends, the gap is similar: 14.6 per cent on average after midterms, against 7.1 per cent in other years.
Why the record needs care
There are three reasons. The first is the sample: 19 observations, the largest of which, 1954, moves the average by about a point on its own. The second is the start date. In eight of the 19 cases, the index was lower in November of the midterm year than a year before, so part of the later gain was a recovery from a fall. This cycle does not fit that pattern. The S&P 500 closed at 7,580.07 on 30 October, the latest figure in the FRED series when we downloaded it, which is 12.4 per cent above its November 2025 average, by our arithmetic.
The third is method. Measured from election-day close to election-day close a year later, using FRED's daily data, the 2018 gain was 11.7 per cent rather than the 14.0 per cent our monthly method gives, and the 2022 gain was 14.5 per cent rather than 13.9. The direction held in both. The size depends on the dates chosen. That is our reading of the data, not a forecast.
What does Congress face after the vote?
The first deadline is government funding, 38 days after the election. A stopgap spending law signed on 2 September, the Continuing Appropriations and Extensions Act, 2027, funds every agency covered by the 12 regular appropriations bills through 11 December, according to the Congressional Research Service. Unless Congress passes those bills or another stopgap, a funding gap begins on 12 December. The same law keeps the National Flood Insurance Program, and its $30.4 billion in borrowing authority, running for as long as the stopgap lasts. Surface transportation programs extended in the law also run to 11 December, according to a WilmerHale client alert of 14 October.
The second date is 31 December, when the Export-Import Bank's charter expires. Congress last extended it in December 2019 for seven years, and if it lapses the bank "would be unable to approve new transactions," the Congressional Research Service says. It could still manage its existing obligations.
By our count, that is 38 days to the funding deadline, 58 to the Ex-Im deadline and 61 to the day the new Congress is sworn in. Whatever Tuesday's result, the members who decide the first two deadlines are the ones already in office.
What to watch
The market has a decent record after midterms, and the calendar is the first test of this one. Earlier on Cranberry, we compared household prices with those before the 2022 midterms and set out the $11.8 billion Florida property tax measure on today's ballot. Neither the outcomes nor the market's next year are known. The first number that settles anything is the vote count. The second is whether a spending bill reaches the President's desk by 11 December.
Monthly S&P Composite index levels and real total return figures are from Robert Shiller's online data workbook (ie_data.xls, downloaded from shillerdata.com on 3 November 2026). The 2018 and 2022 November levels were checked against the average of daily S&P 500 closes in the Federal Reserve Bank of St. Louis FRED series SP500, which also supplied the 30 October 2026 close and the election-day-to-election-day comparisons. The 12-month changes, averages, counts and table are this publication's arithmetic. The stopgap law, its 11 December expiry, its NFIP extension and its divisions are from the Congressional Research Service report R49353 of 17 September 2026. The Export-Import Bank charter date and the effect of a lapse are from CRS report R43581, updated 7 May 2026. Surface transportation's 11 December expiry is from a WilmerHale client alert of 14 October 2026. Senate and governor counts are from Ballotpedia (9 March 2026), the U.S. Senate's Class II list and the National Governors Association. The analysis is our own.
Topics marketsmidterm electionsS&P 500Congress