U.S. shops, gas stations and restaurants took in $748.2 billion in October 2026, seasonally adjusted, up 0.2 per cent from September and 6.8 per cent from a year earlier, the Census Bureau said in its advance retail sales report on Tuesday 17 November. The bureau said the monthly change was too small to distinguish from zero.
The yearly figure is the larger one, and it has a lopsided source. Americans spent $47.8 billion more a month at retailers and restaurants than in October 2025. By our breakdown of the bureau's store-type figures, $16.0 billion of that, a third, was spent at gas stations, which account for less than a tenth of all sales.
Where did the extra money go?
To the pump first, and to online sellers second. The table below sorts the bureau's 13 store categories by how much each added to the yearly increase.
| Store type | Oct 2025 | Oct 2026 | Change | Change % | Share of total increase |
|---|---|---|---|---|---|
| Gasoline stations | 52.6 | 68.6 | +16.0 | +30.3 | 33.4% |
| Nonstore retailers (mostly online) | 114.7 | 128.2 | +13.5 | +11.8 | 28.2% |
| Restaurants and bars | 86.8 | 92.9 | +6.1 | +7.0 | 12.8% |
| General merchandise | 79.0 | 81.8 | +2.8 | +3.5 | 5.9% |
| Building materials and garden | 41.8 | 44.2 | +2.3 | +5.6 | 4.9% |
| Miscellaneous stores | 14.6 | 16.5 | +1.9 | +13.3 | 4.1% |
| Motor vehicles and parts | 135.2 | 137.0 | +1.8 | +1.3 | 3.7% |
| Clothing and accessories | 25.6 | 26.4 | +0.8 | +3.1 | 1.7% |
| Food and beverage stores | 84.3 | 85.1 | +0.7 | +0.9 | 1.6% |
| Sporting goods, hobby, books | 8.1 | 8.7 | +0.6 | +7.1 | 1.2% |
| Electronics and appliances | 7.3 | 7.8 | +0.6 | +7.7 | 1.2% |
| Health and personal care | 39.9 | 40.3 | +0.4 | +1.0 | 0.9% |
| Furniture and home furnishings | 10.4 | 10.7 | +0.3 | +2.5 | 0.5% |
| Total | 700.4 | 748.2 | +47.8 | +6.8 | 100% |
Two categories, gas stations and nonstore retailers, produced 61.6 per cent of the increase while making up 26.3 per cent of sales. Grocery and drink stores, the other place households cannot easily avoid, grew 0.9 per cent, well under any measure of inflation. Car dealers, the largest category, grew 1.3 per cent.
Did people buy more gasoline?
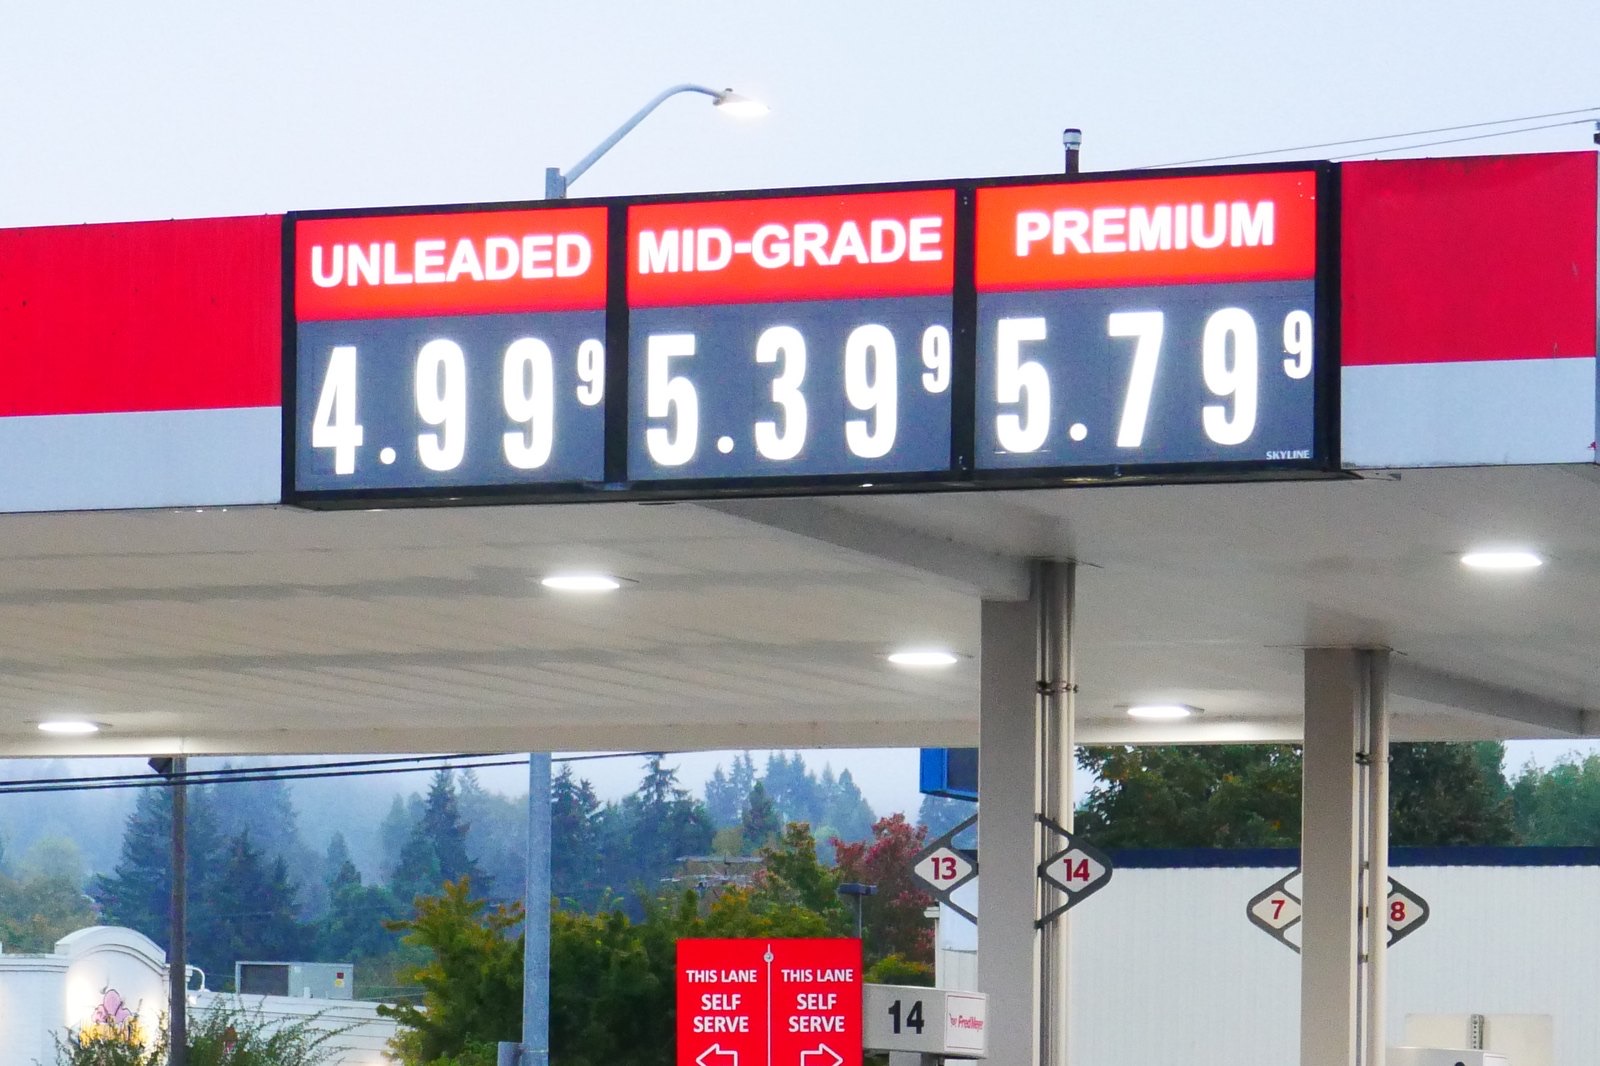
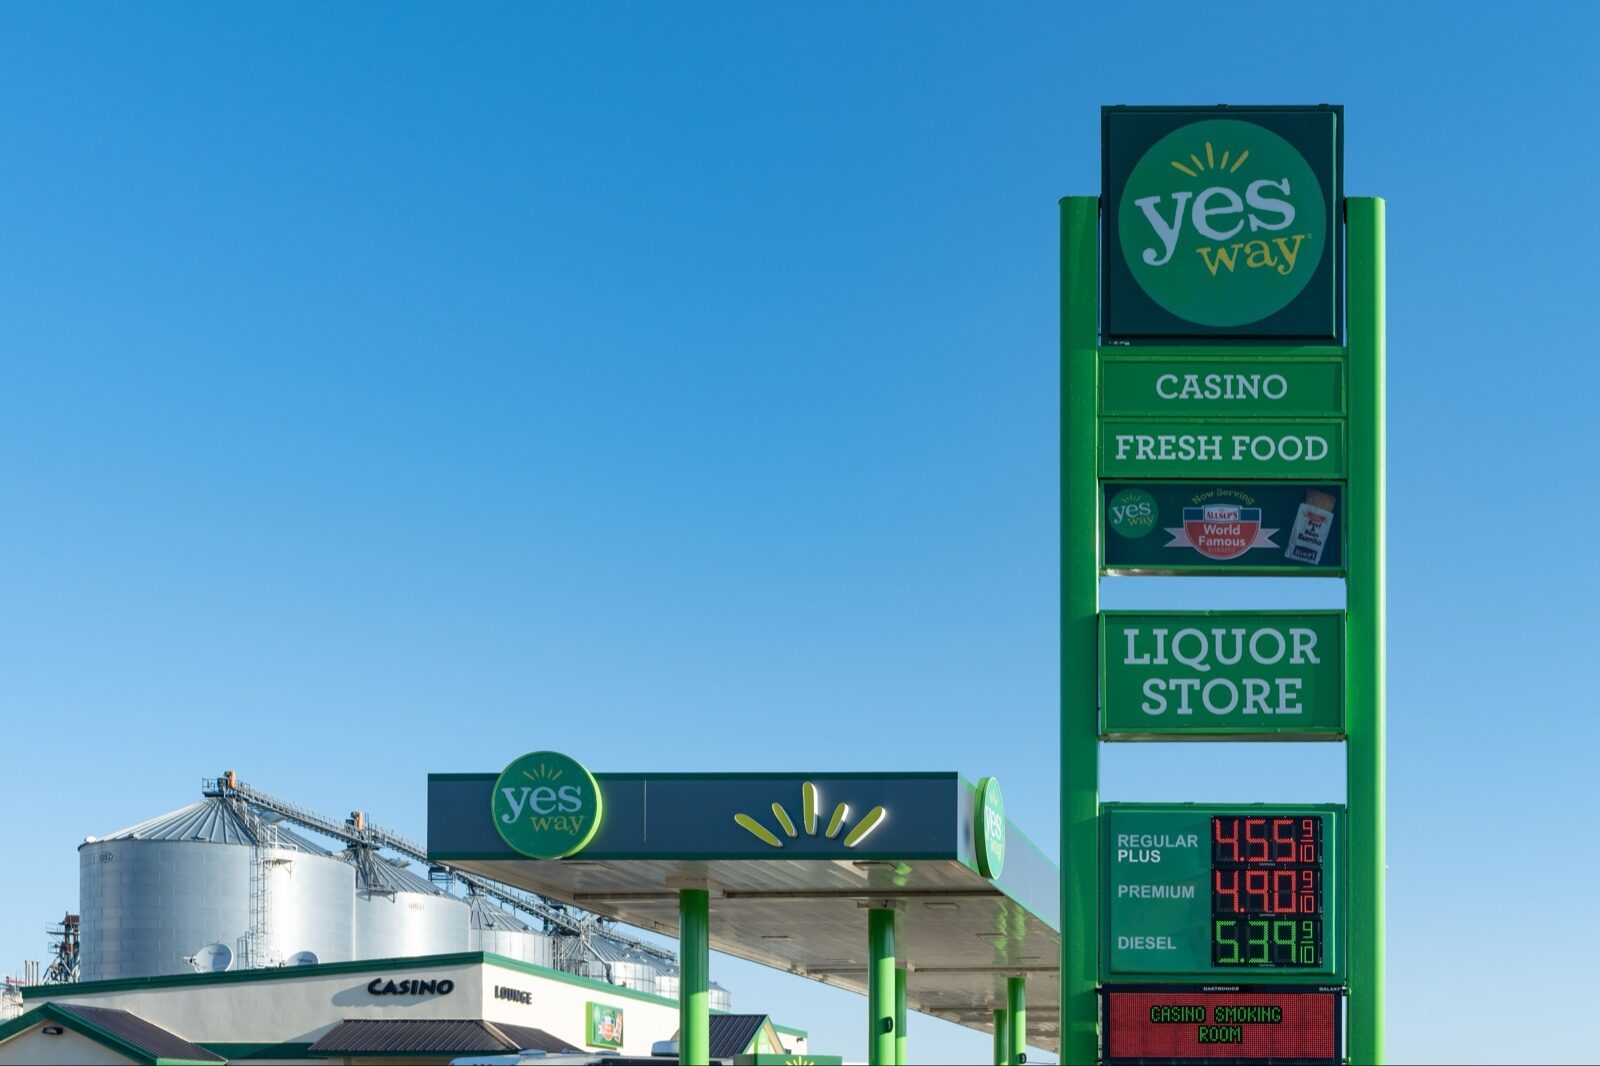
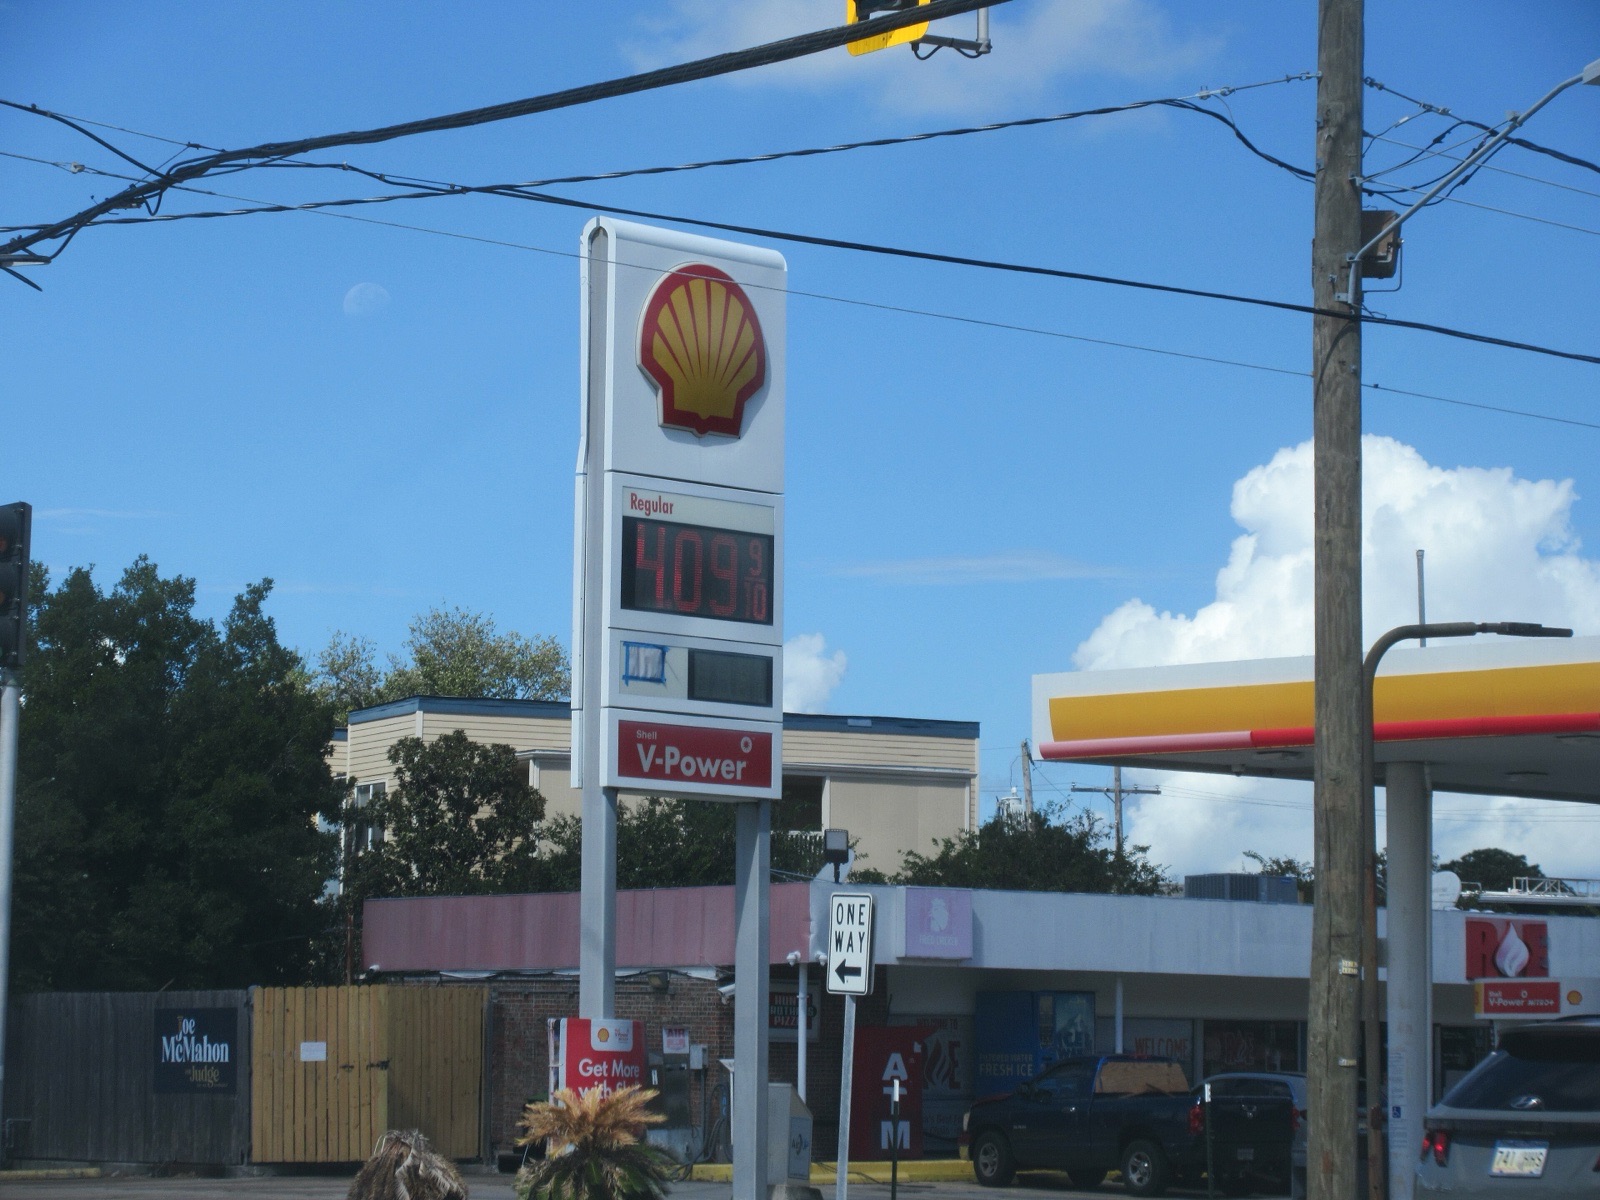
Probably less. The Energy Information Administration's weekly survey of regular gasoline averaged $4.31 a gallon across October's four readings, against $3.06 in October 2025, a rise of 40.8 per cent. Gas station sales rose 30.3 per cent. If the price went up by more than the takings, the quantity bought fell. By our arithmetic the gap implies about 7.5 per cent less volume.
That figure needs a caution. Gas station sales include coffee, snacks and cigarettes, and the EIA price is a national average rather than what each station charged. It is a rough guide, not a count of gallons. The direction is clearer than the size.
October's monthly figures point the same way. Gas station sales rose 1.5 per cent from September while the EIA average price fell slightly, from about $4.35 to $4.31. The consumer price index for gasoline, which is seasonally adjusted and measures something different, rose 1.0 per cent.
What does the rest of the economy look like?
Slower. Leave out gas stations and sales rose 4.9 per cent in a year and 0.1 per cent in October. Consumer prices rose 0.4 per cent in October, the Bureau of Labor Statistics said on 10 November. By our arithmetic, using the unrounded index, overall retail sales fell about 0.1 per cent in October once prices are taken out, and the non-gasoline part fell about 0.3 per cent. Those are approximations: the consumer price index covers rent, insurance and other services that are not sold in shops.
A year-on-year real figure is harder, because the bureau never collected October 2025 prices during last year's shutdown. When we rebuilt the missing annual inflation rate last week we put it at about 4 per cent. On that basis, retail sales grew roughly 2.7 per cent in real terms over the year, and less than 1 per cent once gasoline is removed. That is our estimate, not an official one.
Online sellers are the exception. Nonstore sales rose 11.8 per cent in a year and 1.2 per cent in October, well ahead of total sales on both counts. Cars pulled the other way: dealers' sales fell 1.6 per cent in October. In September, when we stripped out cars and gasoline, the rest of retail rose 0.2 per cent. On the same basis, by our arithmetic, October's figure was 0.5 per cent, so the weak headline owes more to car dealers than to the shops behind them.
What to watch
The advance estimate is built from about 4,800 firms and will be revised with the full survey on 16 December, when the bureau also publishes November, the month that includes Thanksgiving weekend. The EIA's weekly price fell to $3.995 on 9 November, the first reading under $4 since mid-July. If it stays there, gas station sales will flatter November's headline less than they flattered October's, and the gap between what households spend and what they get for it will be easier to see.
Retail sales totals, monthly and yearly changes and confidence intervals are from the Census Bureau's Advance Monthly Sales for Retail and Food Services, October 2026 (release CB26-181, 17 November 2026). Store-type figures are the bureau's seasonally adjusted series as published on FRED by the Federal Reserve Bank of St. Louis, read 17 November. Gasoline prices are monthly averages of the Energy Information Administration's weekly U.S. regular retail price (FRED series GASREGW). The October consumer price figures are the Bureau of Labor Statistics' release of 10 November as published on FRED (CPIAUCSL and the gasoline index). The shares, ex-gasoline totals, price-versus-sales comparison and real-growth estimates are this publication's arithmetic. The analysis is our own.
Topics moneyretail salesCensus Bureauconsumer spendinggasolineinflationeconomic data