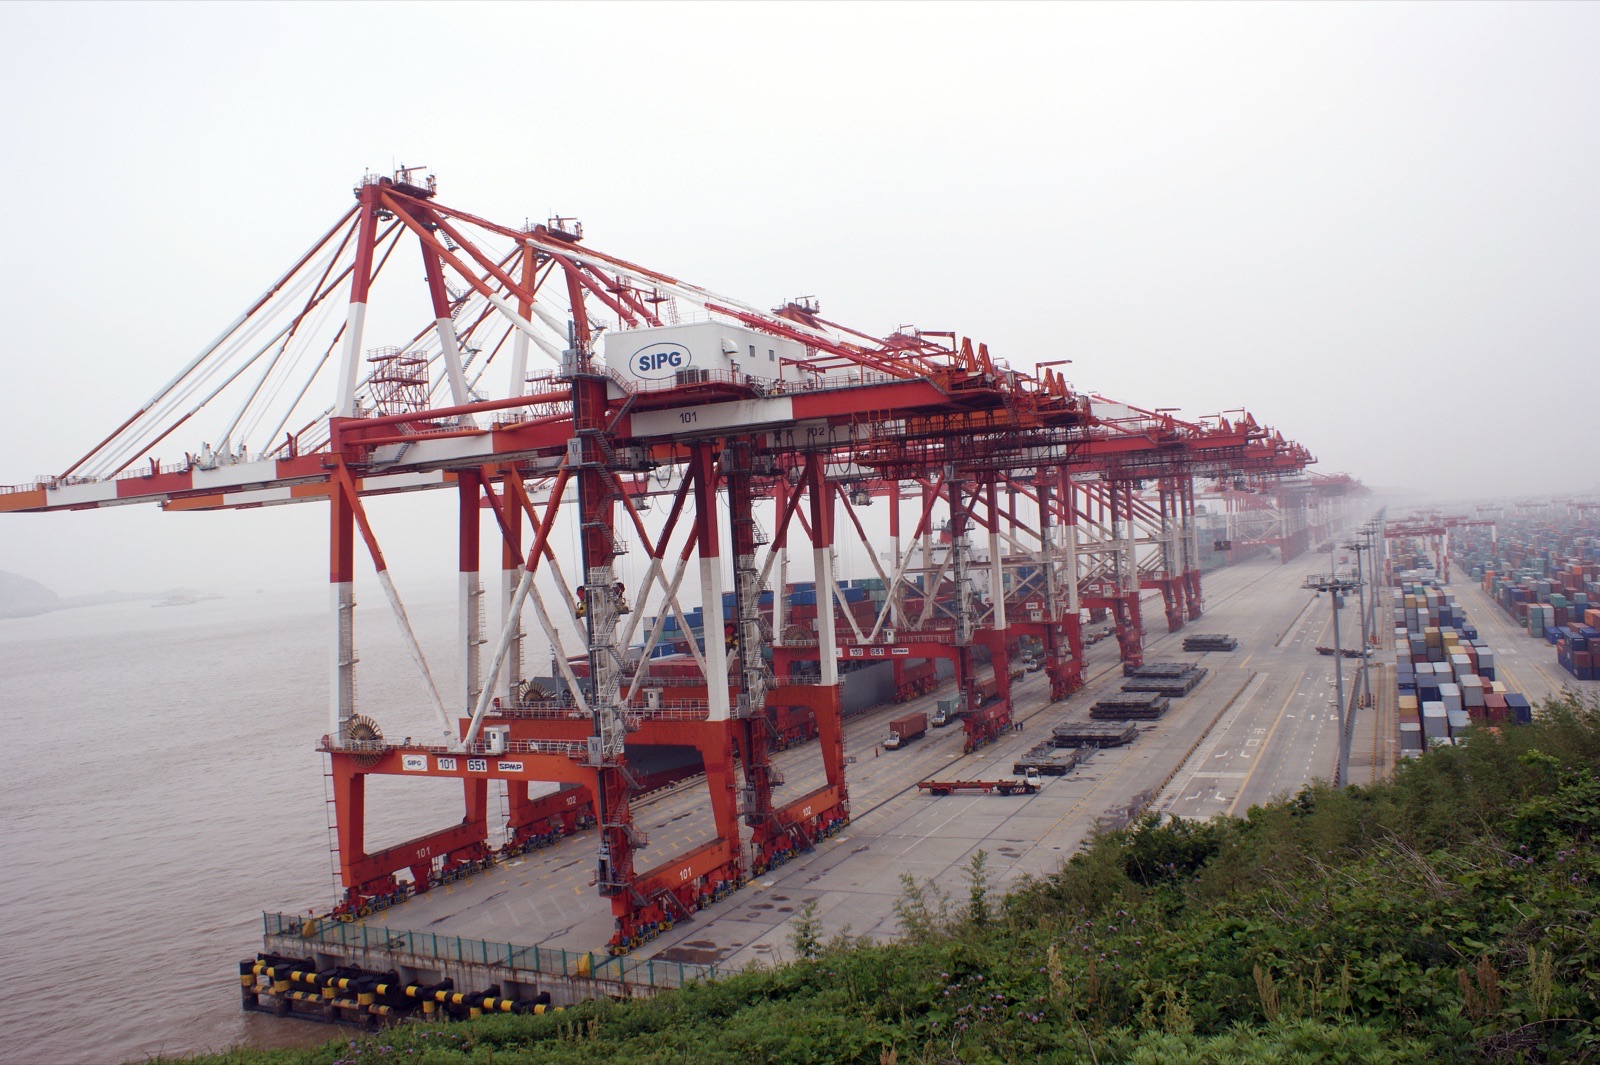
Chinese coal mines charged 36.6 per cent more for their output in October than a year earlier. Chinese clothing makers charged 1.3 per cent less.
China's producer price index rose 5.7 per cent in October 2026 from a year earlier, up from 5.0 per cent in September, the National Bureau of Statistics said on 9 November. Prices of means of production rose 7.4 per cent and supplied about 5.77 points of the increase, while prices of consumer goods leaving Chinese factories fell 0.1 per cent.
A year earlier the same index was falling 2.1 per cent. Reuters, as published by the New Straits Times, called it the largest annual rise since June 2022, citing LSEG data.
Where is the inflation coming from?
From the bottom of the supply chain. By industry, the bureau's table shows coal mining prices up 36.6 per cent from a year earlier, oil and gas extraction up 35.0 per cent and the processing of petroleum and coal up 29.9 per cent. Chemicals rose 16.4 per cent and non-ferrous metal smelting 18.6 per cent.
Further up the chain, the increases fade. Car makers' prices fell 1.8 per cent, medicines fell 3.2 per cent, and clothing 1.3 per cent. Computers and electronics were the exception among finished goods, up 5.9 per cent. Electricity and heat supply prices fell 3.8 per cent.
Chinese factories are also paying more than they charge. The purchasing price index, which measures what industrial companies pay for inputs, rose 7.9 per cent, led by fuel and power at 18.6 per cent and raw chemical materials at 16.8 per cent. By our arithmetic, input prices have risen 2.2 points faster than output prices over the year, which is a squeeze on margins for anyone who cannot pass costs on.
What are Americans paying for Chinese goods?
More than a year ago, though by less. The Bureau of Labor Statistics' import price index for goods from China stood at 100.1 in September 2026, against 97.1 in September 2025. That is a rise of 3.1 per cent, by our calculation, the largest 12-month increase since June 2022. The index measures prices before import duties, so it shows what Chinese sellers are charging, not what tariffs add.
| Month, 2026 | China PPI, 12-month change | China consumer goods PPI | U.S. import prices from China, 12-month change |
|---|---|---|---|
| January | -1.4% | -1.7% | -2.6% |
| February | -0.9% | -1.6% | -2.3% |
| March | 0.5% | -1.3% | -1.4% |
| April | 2.8% | -1.0% | -0.8% |
| May | 3.9% | -0.8% | 0.4% |
| June | 4.1% | -0.9% | 0.9% |
| July | 3.5% | -0.8% | 2.1% |
| August | 3.8% | -0.5% | 2.5% |
| September | 5.0% | -0.1% | 3.1% |
| October | 5.7% | -0.1% | due 17 November |
The two series turned positive about two months apart, China's in March and the American import index in May. Since April the U.S. index has risen every month, from 97.7 to 100.1, which takes it back to roughly where it was at the end of 2024, before it fell through most of 2025.
The table also shows a gap. China's consumer goods prices are still slightly lower than a year ago, yet American importers are paying 3.1 per cent more. The U.S. index covers all goods from China, including the machinery, electronics and materials that dominate trade, not just consumer products. The rise in Chinese electronics prices and the jump in materials fit that pattern. That is our reading of two different indexes, not a link either agency has drawn.
From mines to shelves
The route to American prices runs through costs before it reaches shelves. In the United States, wholesale prices rose 6.3 per cent in the year to September, and consumer prices rose about 4.0 per cent in the year to October on our estimate for a month the government could not measure. The Chinese figures suggest the energy shock is now running through the world's largest manufacturer as well.
Not every material is rising. China's purchasing prices for timber and paper pulp were down 0.5 per cent, and for ferrous metals down 1.1 per cent, which is a problem for producers like the pulp maker Mercer International, now in Chapter 11, whose net price in China fell over the year. Demand at home remains weak, as China's third-quarter growth figures showed, with investment still falling.
The next data point is American. The Bureau of Labor Statistics is due to publish October import prices on 17 November, the first reading that can be set against China's 5.7 per cent. Like the consumer price index, the import series has no October 2025 value, so its 12-month change for October may not be published either.
China's October 2026 producer and purchasing price figures, the contribution of means of production and consumer goods, and the industry figures are from the National Bureau of Statistics' release published on 9 November 2026 (its English version is dated 10 November). Monthly 2026 figures are from the bureau's releases for each month, and the October 2025 figure from its release of 10 November 2025. The comparison with June 2022 is Reuters', citing LSEG data, as published by the New Straits Times on 9 November 2026. U.S. import price indexes for goods from China are from the Bureau of Labor Statistics series EIUCOCHNTOT, retrieved on 11 November 2026, and the release date for October import prices from its schedule. Twelve-month changes in the U.S. series, its comparisons with earlier years and the gap between purchasing and selling prices are this publication's arithmetic. The analysis is our own.
Topics worldChinaproducer pricesPPIinflationBureau of Labor StatisticsNational Bureau of Statisticstradeenergy prices