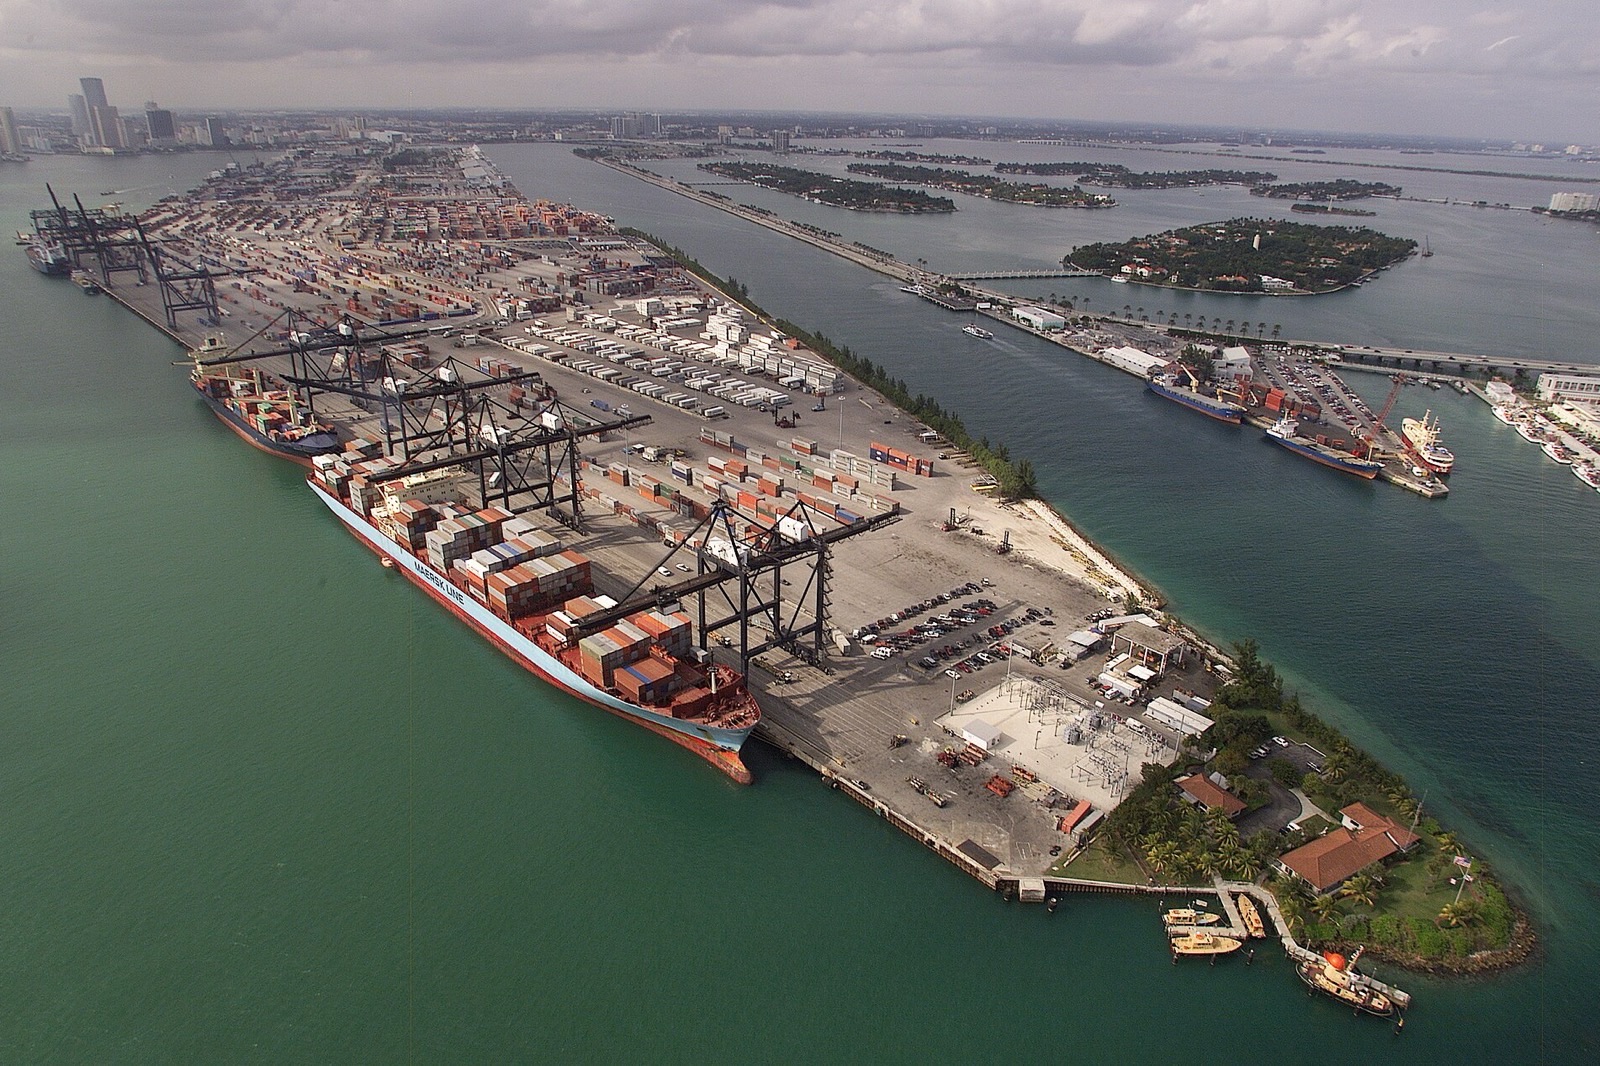
The Gulf Coast has carried America's export boom this year. Texas and Louisiana together shipped $105.2 billion more in goods abroad in the first nine months of 2026 than in the same months of 2025, by this publication's sum of Census Bureau state export data. That is 46 per cent of the national increase.
Total U.S. goods exports were $1.85 trillion from January to September, up $229.9 billion, or 14.2 per cent. Exports rose in 40 states and the District of Columbia and fell in ten, by our count.
Which states drove the increase?
We summed each state's monthly exports for January to September in 2024, 2025 and 2026, using the Census series that assigns exports to the state where the goods began their journey to the border, known as the origin of movement. That is not always the state where they were made, a caveat that matters most for goods consolidated at ports.
| State | 2024 | 2025 | 2026 | Change, $bn | Change |
|---|---|---|---|---|---|
| Texas | 342.2 | 336.5 | 420.4 | +83.9 | +24.9% |
| Louisiana | 62.3 | 67.5 | 88.8 | +21.3 | +31.5% |
| New York | 73.2 | 109.7 | 125.6 | +15.8 | +14.4% |
| Utah | 13.5 | 13.6 | 25.0 | +11.5 | +84.4% |
| Arizona | 24.1 | 34.3 | 45.1 | +10.8 | +31.6% |
| Ohio | 43.4 | 41.5 | 50.3 | +8.9 | +21.4% |
| California | 135.8 | 140.3 | 148.1 | +7.8 | +5.6% |
| Florida | 54.0 | 58.5 | 65.6 | +7.1 | +12.2% |
| Washington | 43.4 | 48.5 | 55.1 | +6.6 | +13.6% |
| New Jersey | 33.0 | 32.4 | 38.8 | +6.4 | +19.7% |
| Colorado | 7.9 | 8.5 | 8.1 | -0.3 | -4.0% |
| Nebraska | 6.1 | 5.9 | 5.4 | -0.5 | -7.9% |
| Missouri | 14.9 | 15.1 | 14.5 | -0.6 | -4.1% |
| Indiana | 45.3 | 51.1 | 50.0 | -1.1 | -2.1% |
| Alabama | 20.5 | 19.4 | 17.1 | -2.3 | -11.7% |
| United States | 1,547.4 | 1,617.6 | 1,847.5 | +229.9 | +14.2% |
Changes are computed from unrounded figures.
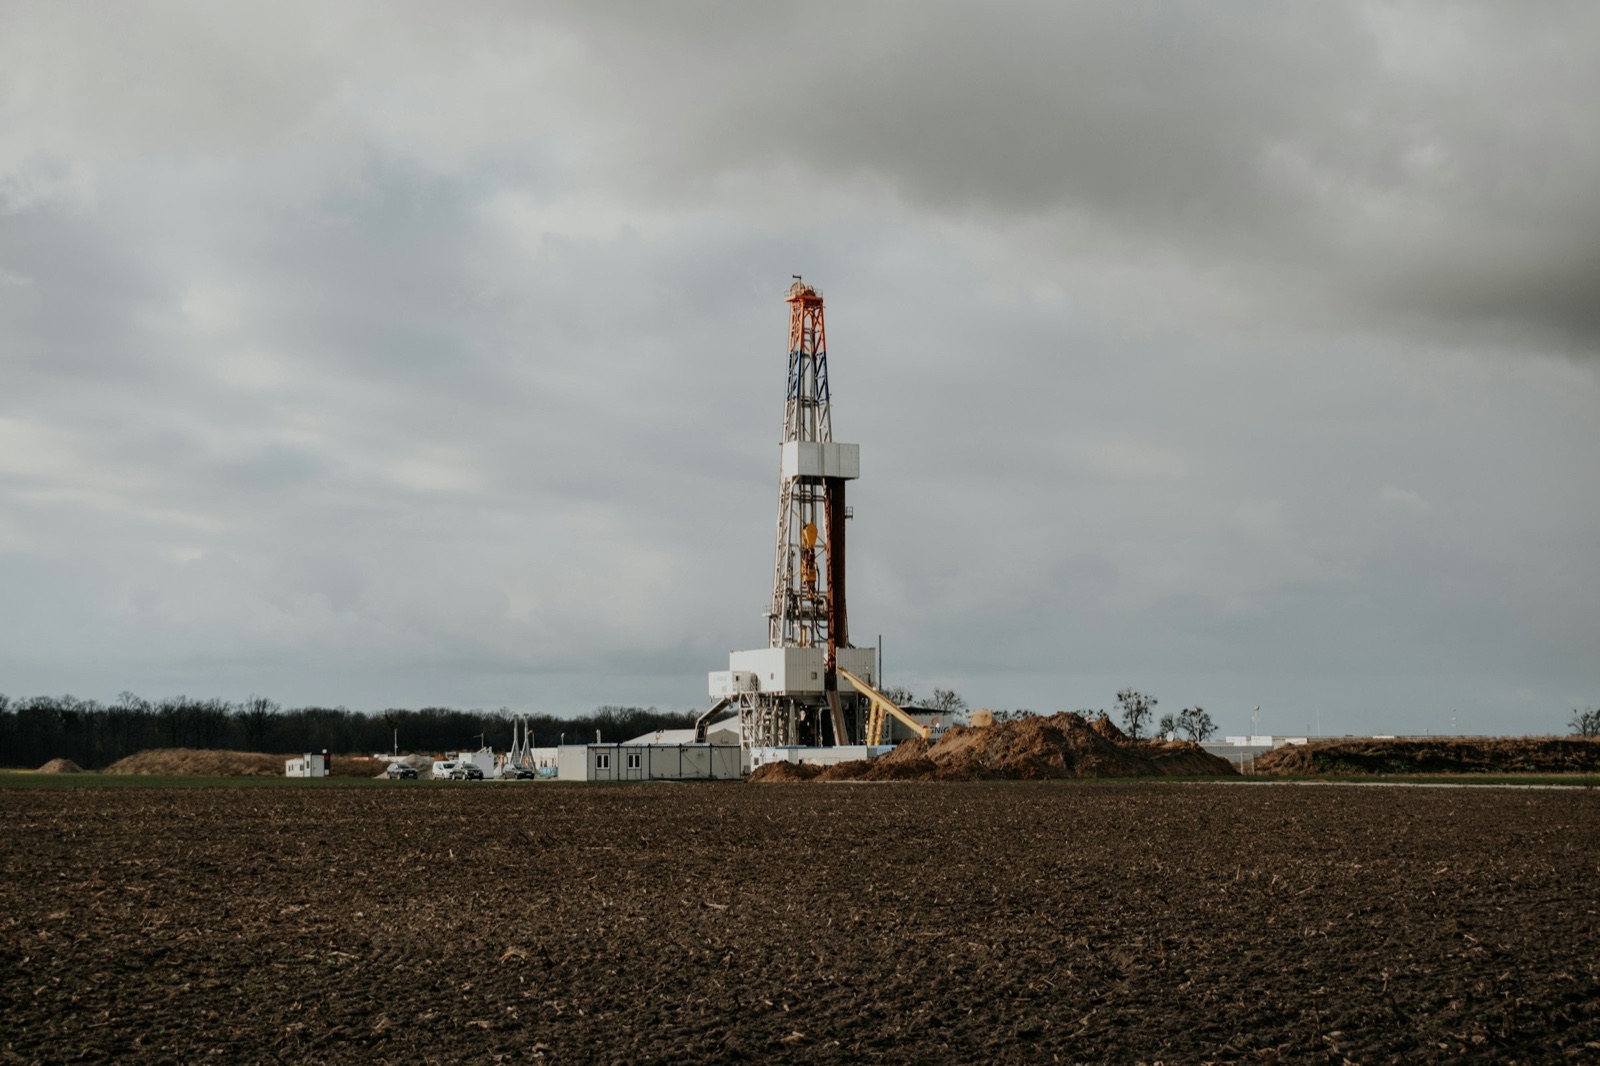
Texas alone accounts for more than a third of the national gain, and its exports are now about a quarter higher than in either of the past two years. Louisiana's are 31.5 per cent higher. The Census series does not say what was shipped, but the energy data point in one direction.
Is it oil?
Mostly, on the evidence available. The Energy Information Administration's petroleum export data show that the Gulf Coast region, which the agency calls PADD 3 and which takes in Texas and Louisiana, shipped an average of 10.8 million barrels a day of crude oil and petroleum products in January to August 2026, 89 per cent of the national total. Its volume rose by about 1.55 million barrels a day from the same months of 2025, which is 98 per cent of the national increase, by our arithmetic.
Volumes were not the whole story. Prices were higher too: West Texas crude averaged $86.69 a barrel in January to October, against $66.75 a year earlier, according to EIA data. More barrels at higher prices is the arithmetic of the Gulf Coast's gain. The same price shock has not produced more oil jobs, and in the spring it raised the value of what oil states produced more than the volume.
What about Utah and New York?
They are different stories. Utah's exports rose 84.4 per cent, to $25.0 billion. Refined gold "accounts for almost half of Utah's exports," Utah Public Radio reported last December, and about 98 per cent of it goes to the United Kingdom. The census figures we used do not break out gold, so we cannot say how much of this year's jump it explains.
New York's exports were up 14.4 per cent for the nine months but fell 12.0 per cent year on year in the third quarter, by our calculation. A state whose gain is behind it is a different case from Texas, where third-quarter exports were up 29.9 per cent.
Who lost ground?
Ten states exported less than a year earlier. Alabama's exports fell 11.7 per cent, the largest drop of any state in both dollars and percentage; Vermont's fell 10.0 per cent from a much smaller base. Indiana and South Carolina, both big exporters of manufactured goods, were slightly lower, and both fell faster in the third quarter: Indiana by 21.6 per cent and South Carolina by 7.9 per cent. The Census series does not give the products, so we do not know which lines fell.
What to watch
The Census Bureau will publish October trade data, including the state series, on 8 December 2026. The figures to watch are Texas and Louisiana's October totals. West Texas crude averaged $102.07 a barrel that month, a shade below May's $102.13, and export volumes would need to hold for the Gulf Coast to keep supplying half of the national gain.
Monthly state and U.S. export values (not seasonally adjusted, origin-of-movement basis) are Census Bureau data retrieved via FRED on 13 November 2026, through September 2026, which the bureau published with its trade report on 4 November 2026. Monthly average West Texas Intermediate prices are EIA data via FRED (MCOILWTICO). Petroleum export volumes for the United States and the Gulf Coast (PADD 3) are from EIA petroleum supply data, series MTTEXUS2 and MTTEXP32, retrieved on 13 November 2026. The description of Utah's gold exports is from Utah Public Radio, 2 December 2025. All nine-month totals, changes, shares and rankings are this publication's arithmetic. The analysis is our own.
Topics businesstradeexportsCensus BureauTexasGulf CoastEnergy Information Administration